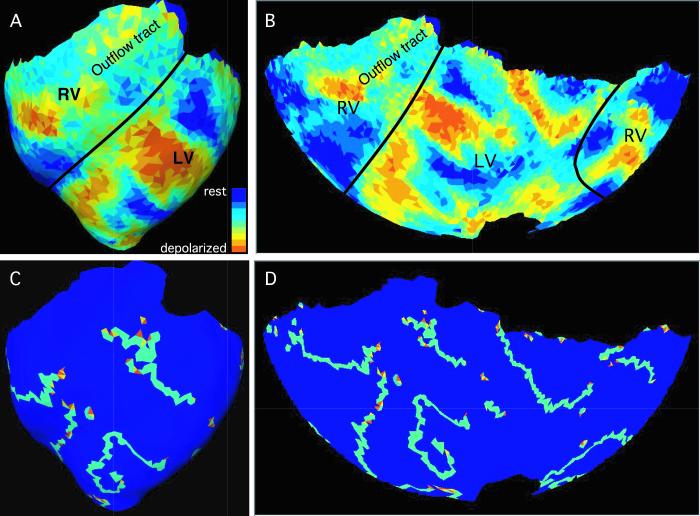
Figure 4.
One frame of a VF episode (episode 6 in Table 1). Panels A and B show fluorescence data. The black lines indicate the approximate boundary between the right and left ventricles. Panels C and D show the wavefronts (light blue triangles) and phase singularities found in the same frame. Yellow and orange phase singularities have opposite chiralities. Panels A and C show an anterior view of the reconstructed epicardial geometry. In panels B and D, a Hammer map projection is used to show the entire epicardium. Movies S1 and S2 animate all frames from this episode.

