
Figure 7.
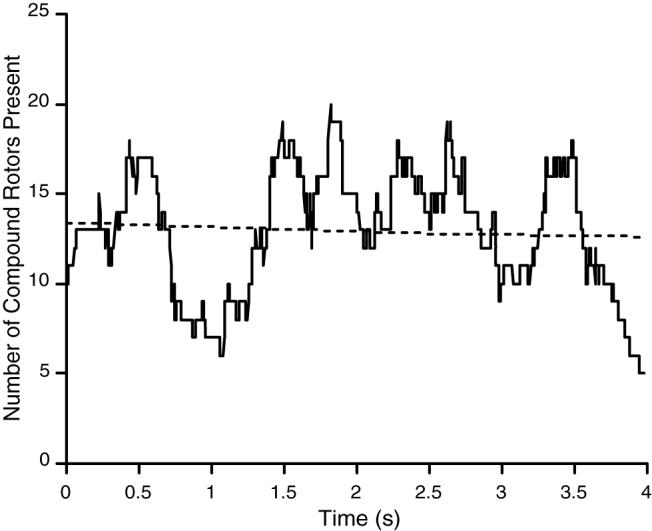
Temporal fluctuation in the number of compound rotors (with lifetimes exceeding 200 ms) simultaneously present on the epicardium. Data are from episode 6 in Table 1. The dotted line is a linear regression line.
Official websites use .gov
A
.gov website belongs to an official
government organization in the United States.
Secure .gov websites use HTTPS
A lock (
) or https:// means you've safely
connected to the .gov website. Share sensitive
information only on official, secure websites.
Temporal fluctuation in the number of compound rotors (with lifetimes exceeding 200 ms) simultaneously present on the epicardium. Data are from episode 6 in Table 1. The dotted line is a linear regression line.