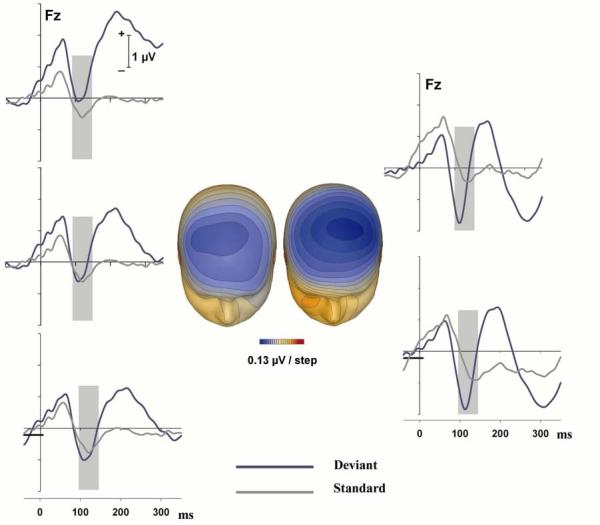
Figure 2.

Top panels: Original grand mean ERPs at Fz for switch (blue curves) and standard trials (gray lines) presented to the left (left panel) and right (right panel) ear. Middle left panel: The same ERPs after using a 1 Hz high pass filter for the switch trials delivered to the left ear. Bottom left panel: The same ERPs using a baseline of −40 to 10 ms in addition to a 1 Hz high pass filter for the deviants of the left ear. Bottom right panel: Grand mean ERPs for switch and standard trials delivered to the right ear using a baseline of −40 to 10 ms. The solid horizontal bars at the bottom of the left and right bottom panels indicate the baseline used for the waveforms of the two bottom panels. The two panels in the middle of the figure: Voltage maps for the negativity associated with a switch to the left ear (left panel) and right ear (right panel).
