
Figure 4.
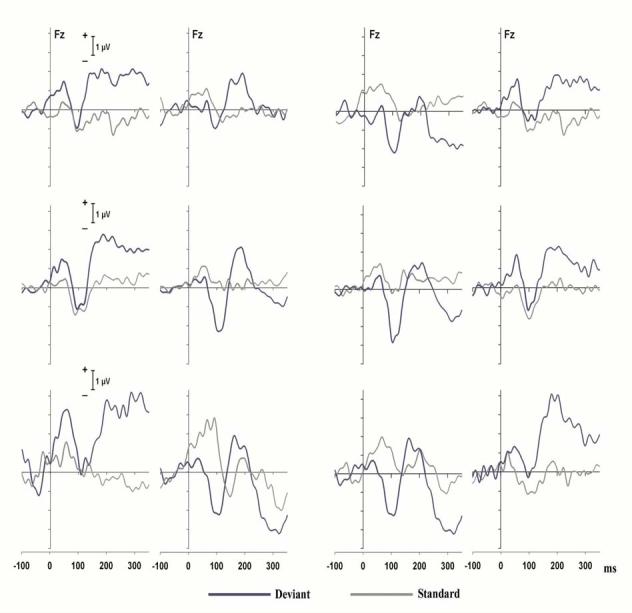
Left two columns: averaged ERPs at Fz for 3 individual subjects for switch (blue curves) and standard trials delivered (gray curves) to the left ear (left column) and the right ear (right column) in the main experiment. Right two columns: same ERPs for the same 3 subjects with the earphones switched.