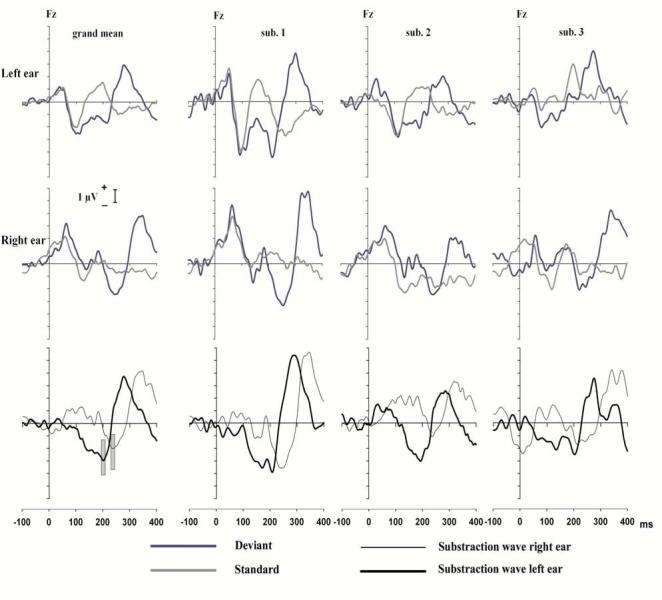
Figure 5.

Far left column: The top panel shows the Grand mean ERPs at Fz for standards (gray lines) and duration deviants (blue lines) for tones delivered to the left ear. The middle panel shows the same ERPs for tones delivered to the right ear. The bottom panel shows the subtraction of the grand mean ERPs elicited by the standards shown in the panels above from the grand mean ERPs elicited by the deviants of the panels above for the left (solid lines) and right (dashed lines) ears. Other columns: Each column contains the data for one of the 3 individual subjects in a manner identical to that for the grand means. The vertical bars in the lower left panel indicate the early and late latency MMNs.
