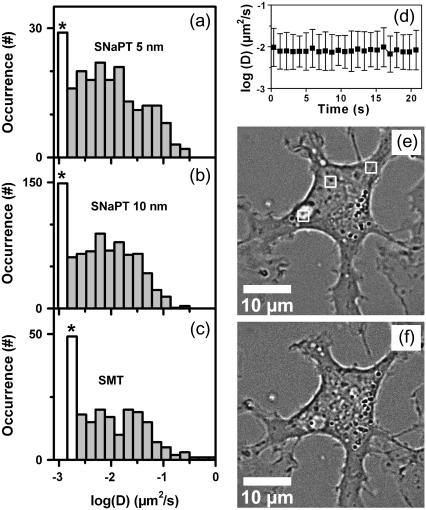
FIGURE 4.
(a–c) Distributions of the instantaneous diffusion constants D of mGluR5a on COS7 cells, obtained with respectively SMT, SNaPT of 10-nm NPs and SNaPT of 5-nm NPs. The first bar (labeled with *) contains all the data for D < Dmin. (d) Evolution of the distribution of instantaneous diffusion constants during long acquisitions (mean and standard deviation of the mobile fraction). (e–f) White light images of a COS7 cell before (e) and after (f) three periods of 10 min continuous illumination over 2 × 2μm2 areas (white frames, e).

