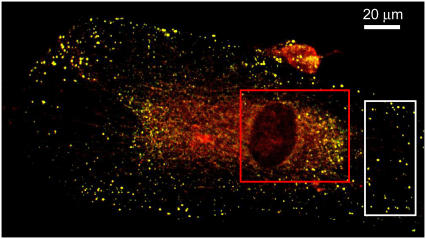
FIGURE 7.
Two-channel overlay RGB image of PDGF-β receptors on human foreskin fibroblast cells immunolabeled with FITC (green) and Alexa-633 (red). The boxes indicate the regions chosen for colocalization analysis. Both methods lead to analogous results in the region indicated by the white box (M1ICCS = 0.98, M2ICCS = 1.0, M1Auto = 0.96, and M2Auto = 0.94). ICCS fails in the region indicated by the red box due to the edge boundaries of the nuclear region while automatic colocalization works well in this regime (M1Auto = 0.92 and M2Auto = 0.35).

