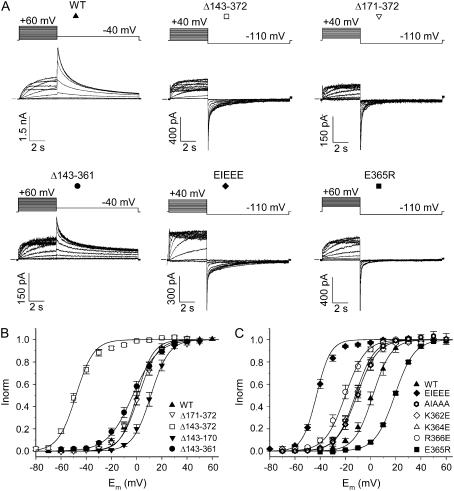
FIGURE 2.
Voltage dependence of activation. (A) Raw current traces of WT HERG and of several deletion and charge reversal mutations with the applied voltage protocol on top. (B) Voltage dependence of activation of the deletion mutations compared to WT. Note the strong negative shift of the midpoint of activation for Δ143–372. (C) Voltage dependence of activation of charge reversal mutations compared to WT.

