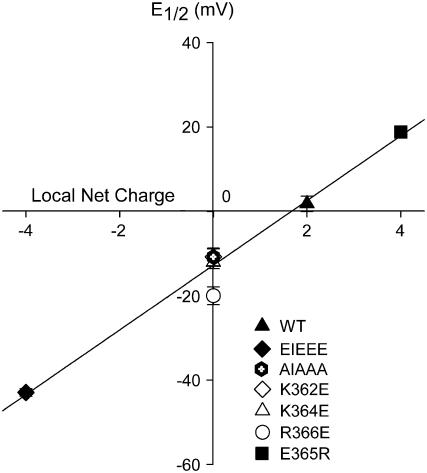
FIGURE 3.
Correlation between the midpoint of activation and the local net charge of the KIKER sequence. E1/2-values were plotted as a function of the local net charge for WT, for the charge reversal mutants (i.e., EIEEE, K362E, K364E, R366E, E365R) and for the AIAAA mutant (Fig. 1). The solid line represents the linear function that was fitted to the data. Goodness-of-fit values were r2 = 0.99 and DF adj. r2 = 0.99 (see Materials and Methods).

