
Figure 2. A. The release of p40 Syt1 WT and p40 Syt1 K326,327,331Q from NIH 3T3 cells.
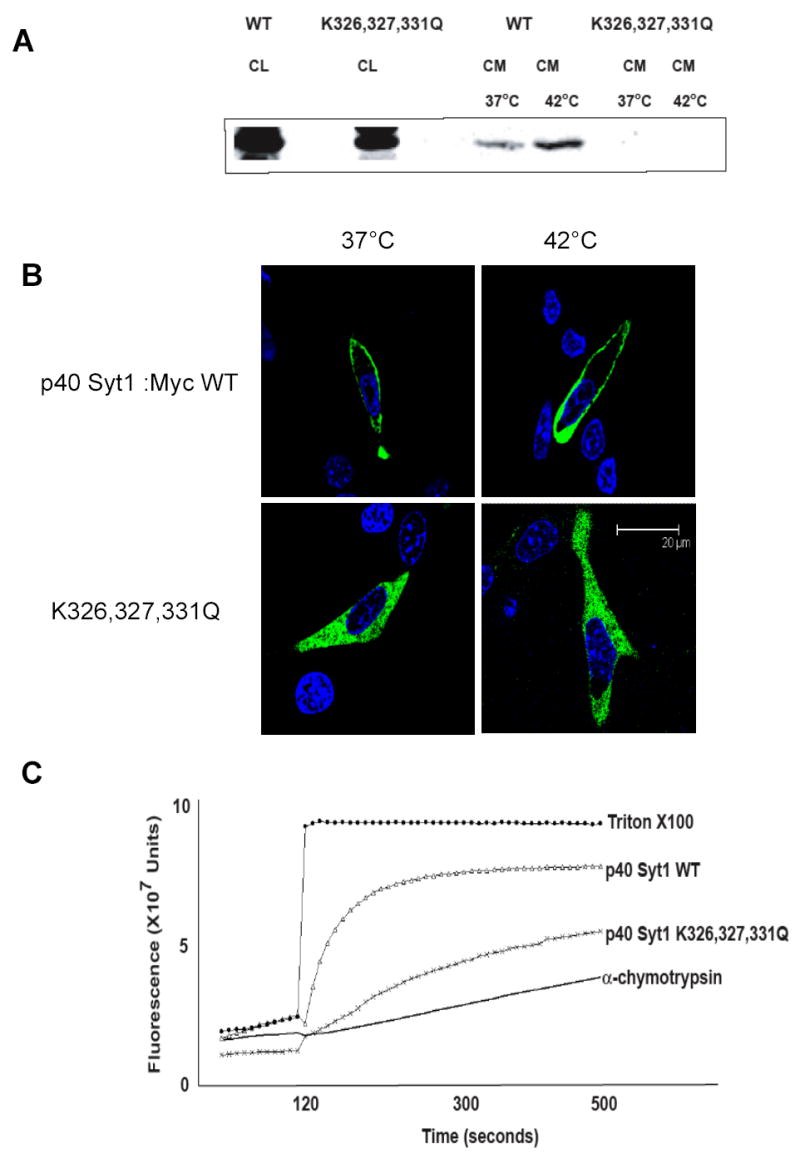
NIH 3T3 cells transfected with p40 Syt1 WT or p40 Syt1 K326,327,321Q were incubated for 2 hours at 37°C or 42°C. p40 Syt1 from conditioned medium was adsorbed to heparin-Sepharose and analyzed by immunoblotting as described [14]. CL- cell lysate; CM- conditioned medium. B. Confocal fluorescence microscopy analysis of p40 Syt1:Myc WT and p40 Syt1:Myc K326,327,331Q cellular localization at normal and stress conditions. NIH 3T3 cells transfected with either p40 Syt1:Myc WT or p40 Syt1:Myc K326,327,331Q were incubated for 2 hours at 37°C or 42°C. The cells were fixed with formaldehyde and immunofluorescently stained for Myc tag (green) as described in the “Materials and Methods”. The nuclei were stained with Hoechst 34580 (blue). The cells were studied using a confocal microscope with an X100 objective. Median horizontal confocal cell sections are presented. Bar- 20 μm. C. Analysis of the CF release from pI liposomes induced by p40 Syt1 WT and p40 Syt1 K326,327,331Q. The experiments on CF release from pI liposomes induced by 500 nM p40 Syt1 WT or p40 Syt1 K326,327,331Q were performed as described in Figure 1.