
Fig. 3.
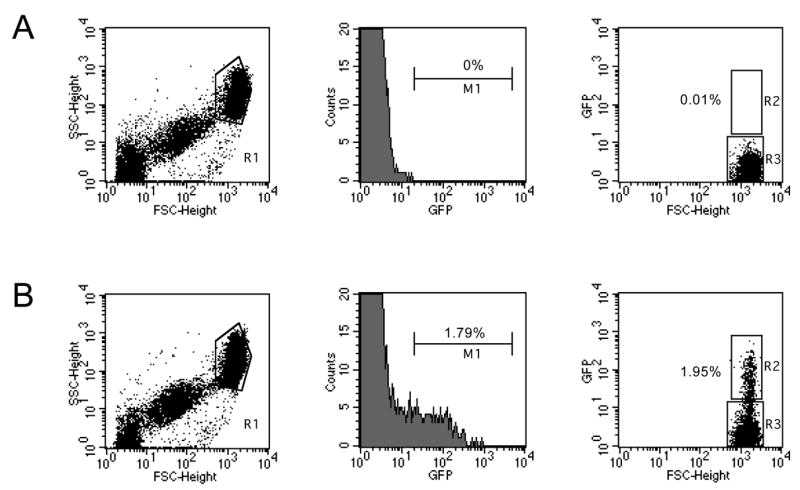
Flow cytometry analysis of fluorescence intensity of live blood stage PyGFP. Blood from infected mice was collected in heparin (400 U/ml) and washed with PBS before resuspension in buffer (PBS 3% FBS). For each sample, 105 cells were analyzed using FACScalibur and Cell Quest software (Becton Dickinson). Dot plot representations of blood cells obtained from wild type (A) or PyGFP (B) infected mice with asynchronous infection. The size analysis (forward (FCS)- and side (SSC)-scatter) shows three populations typical of mouse microplatelets (left population), platelets (central population) and erythrocytes (R1) as described (Chen et al., 2003). The center panel shows the relative GFP-fluorescence intensity of cells in R1. Fluorescent erythrocytes are selected in region M1. The right panel shows the dot plot of fluorescence intensity versus size of cells in R1. Fluorescent erythrocytes are selected in R2, non-fluorescent in R3.