
Figure 3.
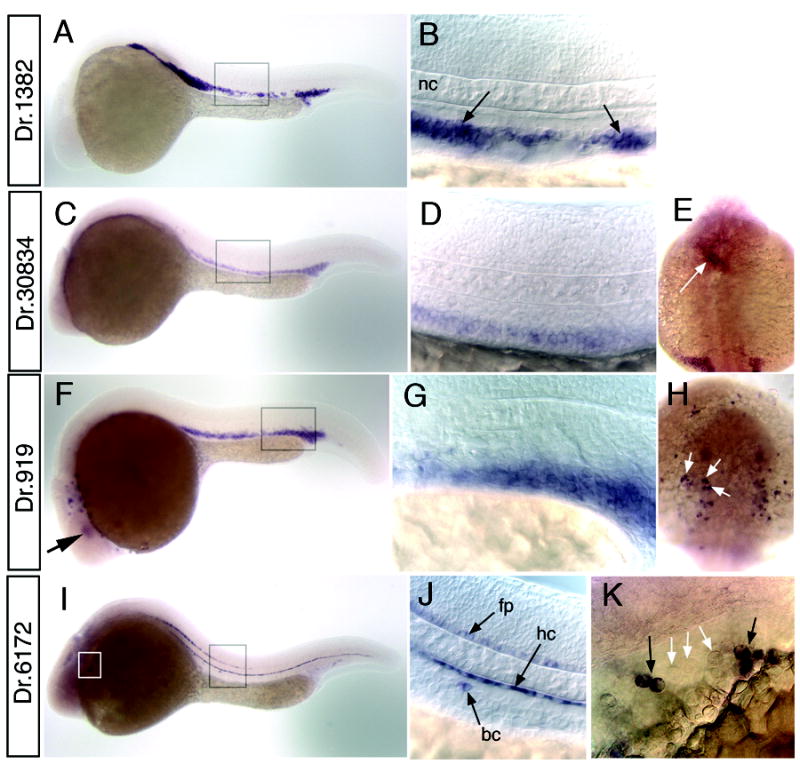
Whole mount in situ hybridization analysis of blood cell markers. A, B. Dr.1382 at 26 hpf; box indicate magnified view in B. B. Arrows indicate expression in erythroid cells; nc – notochord. C-E. Dr.30834 at 26 hpf; box indicates magnified view in D. E. Dorsal view of head, anterior is up; white arrow indicates expression in the heart. F-H. Dr.919 at 24 hpf. F. Box indicates magnified view in G. H. Dorsal view of the head, anterior is up. White arrows denote expression in white blood cells on yolk sac. I-K. Dr.6172 at 24 hpf. I. Black box indicates magnified view in J, white box indicates view in K. J. expression in floor plate (fp), hypochord (hc), and a blood cell (bc). K. Blood cells expressing Dr.6172 indicated with black arrows. White arrows denote adjacent cells with similar morphology that do not express Dr.6172. A-D, F, G, I, J. Lateral view, dorsal is up anterior to the left.