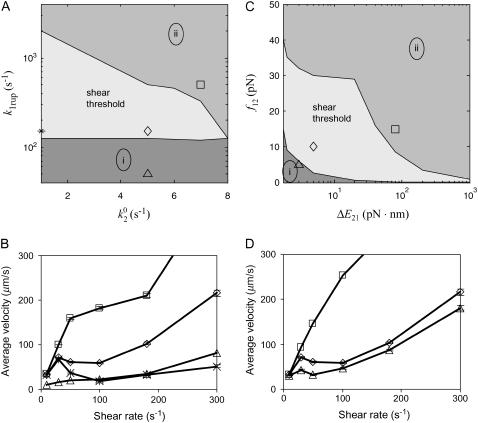
FIGURE 7.
State diagrams for the shear threshold effect in the space of selected catch-slip bond parameters. Other parameters are base case. In region (i), cells travel at <90% Vh at low shear rates. In region (ii), cells do not achieve a minimum in velocity. (A) State-wise off rate parameter space. When k1rup is too small, cells bind and roll even at very low shear rates. When k1rup is too large, cells do not reach a minimum in velocity. The smaller  is, however, the larger k1rup can be and still achieve the minimum in velocity. The shear threshold effect can never occur when
  is too large because cells will not bind well enough to achieve a minimum in velocity. (B) Average velocity as a function of shear rate. An example from each region of the state diagram is shown, with parameters given by the corresponding symbols in A. (C) Transition parameter space. When f12 is too small, cells roll at low shear rates since the system quickly switches to the slow pathway. When f12 is too large, on the other hand, the switch to the slow pathway occurs at too high a force, so that cells cannot roll slowly enough to achieve a minimum in velocity. (D) Average velocity as a function of shear rate. An example from each region of the state diagram is shown with parameters given by the corresponding symbols in C.

