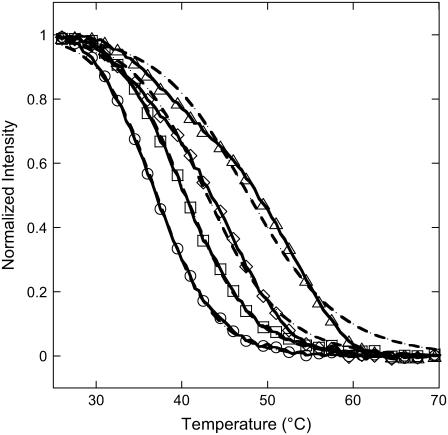
FIGURE 7.
Melting curves (symbols and lines) and theoretical fits with the Langmuir model (dashed lines) for P9 (○), P10 (□), P12 (⋄), and P14 (▵) probes. For each probe, the thermodynamic parameters are estimated from the fit, with ΔCp = −50 cal K−1 mol−1 per basepair. Melting curves are obtained for each spot of the DNA chip from temperature scans in the range 25°C to 70°C with a temperature rate of 2°C/min.

