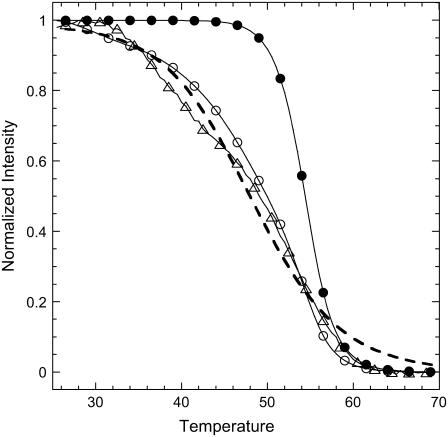
FIGURE 8.
Example of temperature scans simulated for P14 probes in two situations: without (•) and with dispersion in the hybridization segments (○). We observe that the transition is broader in the second situation and compares with the experimental results (▵). The dashed line corresponds to the fit for the thermodynamic parameter determination, with ΔCp = 0 cal K−1 mol−1 per basepair.

