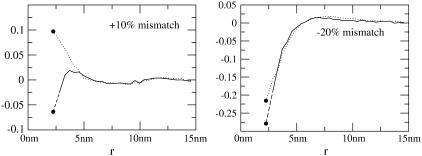
FIGURE 3.
Volume deformation profile  (solid line) and thickness deformation profile
  (dotted line) measured around inclusions set to have either a positive 10% (left) or negative 20% (right) thickness mismatch with the surrounding membrane; these particular profiles are for inclusions of radius R = 2.25 nm. A solid line connects points that were actually measured, whereas a dashed line indicates a linear extrapolation to the boundary of the protein. Circles mark the boundary of the inclusion; the height of the profile at the boundary is either known in advance (in the case of
  or extrapolated (in the case of
  ; see text). The circles marking the estimates of
  represent the data points used in Fig. 4 for R = 2.25 nm.

