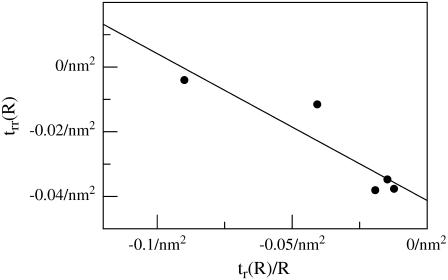
FIGURE 5.
Boundary curvature plot for positively mismatched systems with five smallest radii (boxed data points in Fig. 4). According to the natural boundary condition (Eq. 10), a plot of trr versus tr/R evaluated at the boundary of inclusions with several different radii R should yield linear data with slope −(kc + kG)/kc and intercept −2(c0 + ζt(R)/t0 − ηv(R)/v0). trr(R) and t(R) were measured as described in the section “Simulations: analysis of data”. This plot results in an estimate of kG/kc = −0.55 ± 0.11 and η/v0 = −0.78 ± 0.02 nm−4.

