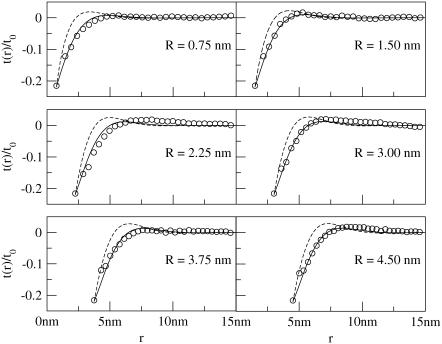
FIGURE 7.
Thickness deformation profiles for negatively mismatched proteins over a range of radii (R = 0.75 nm to 4.5 nm; data for R = 5.25 nm is not shown due to space constraints but is qualitatively very similar to data for R = 4.5 nm). Circles are actual data points. Solid lines correspond to Eq. 7. Protein mismatch is t(R)/t0 = −0.22. Membrane parameters are in Table 1 for the solid lines; dashed lines are the same except kG = 0 and η = 0, corresponding to the theory of A-E. For this negative mismatch case, the theory presented in this article significantly improves upon the results of A-E.

