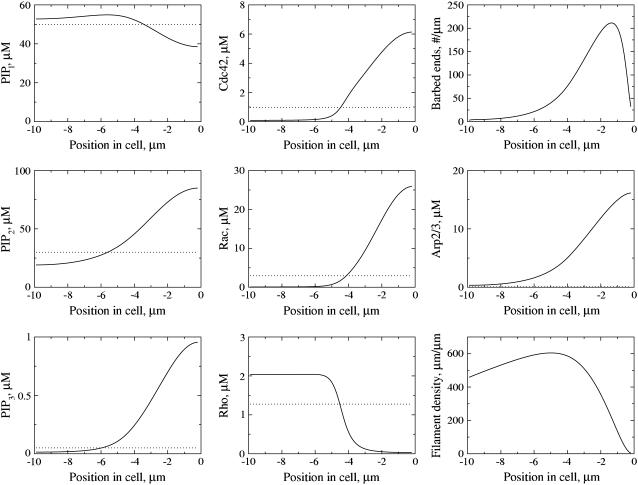
FIGURE 4.
(Left column) Spatial profiles of PIs (from top to bottom: PIP1, PIP2, PIP3); (middle column) Active Rho proteins (Cdc42, Rac, Rho); and (right column) actin (barbed ends, Arp2/3, and filament density) in response to the stimulus described in Fig. 3 a. The spatial profiles are consistent with experimental observations, with PIP2, PIP3, Cdc42, and Rac elevated at the front of the cell and Rho elevated at the rear. The dotted line shows the homogeneous prestimulus distribution (i.e., before a gradient is applied to kPI3K and kPTEN), while the solid line shows the post-stimulus steady-state distribution. The leading edge of the cell is on the right in each frame.

