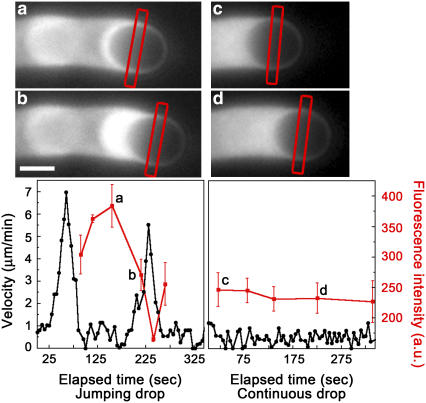
FIGURE 6.
Form changes during the velocity cycle of jumping drops are associated with changes in the amount of actin along the sides of the drop, variations that are not observed during continuous motion. Fluorescence microscopy images using labeled actin of a jumping 1.6-μm radius drop in inverted pear form (a) and kiwi form (b) and a continuous 1.7-μm radius drop (c–d). Accompanying velocity cycle graphs for each drop are shown below the images. Fluorescence intensity (red curves, arbitrary units) was measured along the sides of the drop at various times during drop movement using line scans of fluorescence intensity of the center of the drop, perpendicular to the direction of movement. For the images shown, the region where the fluorescence was measured is marked by the red rectangles, and these points are indicated by the small letters in the velocity graphs. The error bars on the fluorescence intensity indicate the standard deviations from the average of the two sides of the drop. Bar, 2 μm.

