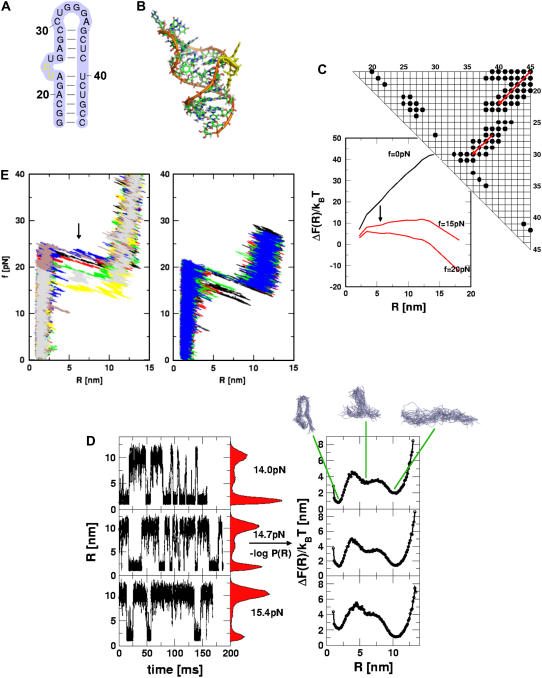
FIGURE 4.
Analysis of force-induced transitions in TAR RNA hairpin. (A) Secondary structure. (B) In the three-dimensional structure, the nucleotides (i = 23, 24) in the bulge are in yellow. (C) The contact map and the energy profile at three values of f. The plot suggests the presence of one intermediate at R ∼ 6 nm when f ≠ 0. (D) The results of force-clamp simulations at fc = 14 pN, 14.7 pN, and 15.4 pN. The dynamics of R is probed for 150 ms and the histograms P(R) are given in the shaded color. The corresponding free energy profiles computed using ΔF(R)/kBT = −log P(R) are shown on the right. The structures that correspond to the three basins of attraction are displayed at the top. (E) FECs at the loading rates,  (ks = 0.7 pN/nm, v = 6.4 μm/s) (left) and
  (ks = 0.7 pN/nm, v = 0.64 μm/s) (right) for a number of molecules. The arrow in the left panel is the signature of a kinetic intermediate, which is absent when rf is reduced.

