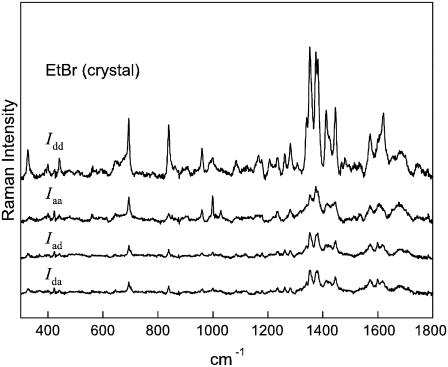
FIGURE 1.
Polarized Raman spectra (785-nm excitation) of an oriented single crystal of ethidium bromide. The spectral traces are labeled from top to bottom (Idd, Iaa, Iad, Ida) in accordance with the polarized Raman intensity components defined in the text. Crystal field splitting is evident for the most intense bands of the Idd spectrum.

