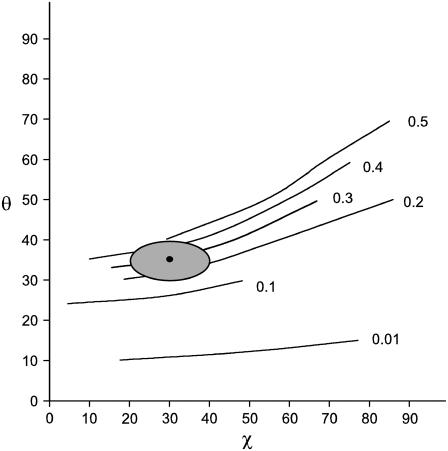
FIGURE 6.
Contour map of Icc/Ibb plotted in θ,χ-space for the 1377 cm−1 Raman band of EtBr. Contour lines were calculated using Eq. 6 and the 1377 cm−1 Raman band tensor determined from the EtBr single crystal (see Fig. 1). The value of Icc/Ibb is indicated to the right of each contour line. Here, θ and χ are Eulerian angles defining the orientation of the Raman tensor coordinate system (xyz) with respect to the coordinate system of the fiber (abc) (27). The allowed values of θ (35 ± 5°) and χ (30 ± 10°) are indicated by the shaded oval area.

