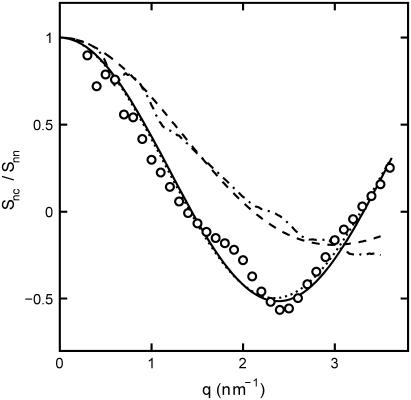
FIGURE 7.
Ratio of the DNA-counterion and DNA partial structure factors  . The dash-dotted line represents the ratio as obtained from the MD simulation. The dotted, dashed, and solid lines represent the ratio in Eq. 8 calculated with the structural parameters in Table 1 and radial counterion profiles resulting from the solution to the PB equation, MD simulation, and MC simulation, respectively. Notice that the ratios pertaining to the PB and MC approaches are almost indiscernible. The circles refer to the experimental SANS results.

