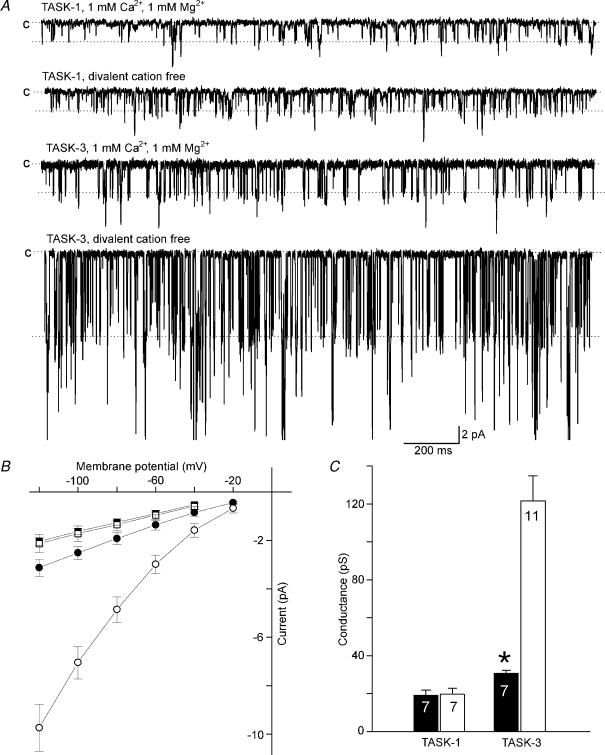
Figure 2. Comparison of the Ca2+ sensitivity of TASK-1 and TASK-3 channels.
A, typical recordings of TASK-1 (top) and TASK-3 (bottom) in the presence and absence of divalent external cations. The level of the closed state (c) and the open state (derived from amplitude histograms) are indicated by broken lines. The transmembrane potential was −120 mV. B, single-channel current–voltage relation of TASK-1 (filled symbols) and TASK-3 (open symbols) in the presence (circles) and absence (squares) of external divalent cations. C, the mean slope conductance at −100 mV of TASK-1 and TASK-3 in the presence (filled bars) and absence (open bars) of external divalent cations. The error bars represent standard deviation. The number of different channels analysed in each case is indicated.

