Figure 2.

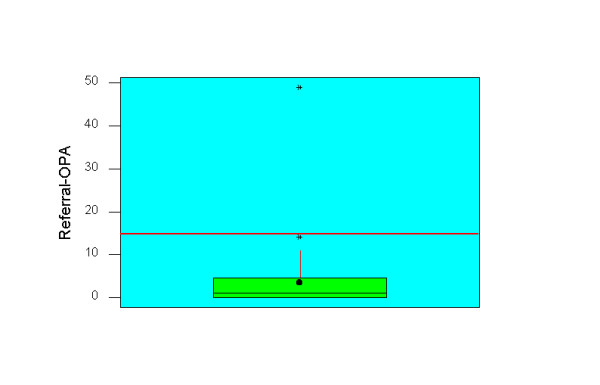
Box and Whisker plot of urgent GP referral to outpatient intervals (n = 133). The red line indicates recommended waiting time and the whisker represents median. The box shows the inter quartile range from 25th to 75th percentile.

Box and Whisker plot of urgent GP referral to outpatient intervals (n = 133). The red line indicates recommended waiting time and the whisker represents median. The box shows the inter quartile range from 25th to 75th percentile.