
Figure 8.
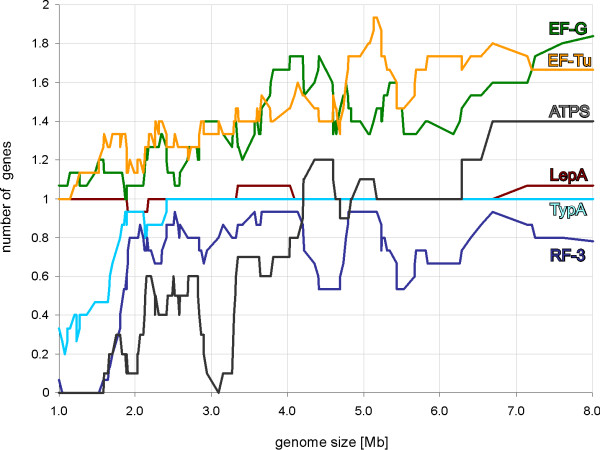
The number of gene copies in each subfamily presented in correlation with genome size. The ATPS proteins include both CysN/NodQ (ATPS2) and ATPS1. A sliding window with length 15 genomes was used to draw the trendline.
Official websites use .gov
A
.gov website belongs to an official
government organization in the United States.
Secure .gov websites use HTTPS
A lock (
) or https:// means you've safely
connected to the .gov website. Share sensitive
information only on official, secure websites.
The number of gene copies in each subfamily presented in correlation with genome size. The ATPS proteins include both CysN/NodQ (ATPS2) and ATPS1. A sliding window with length 15 genomes was used to draw the trendline.