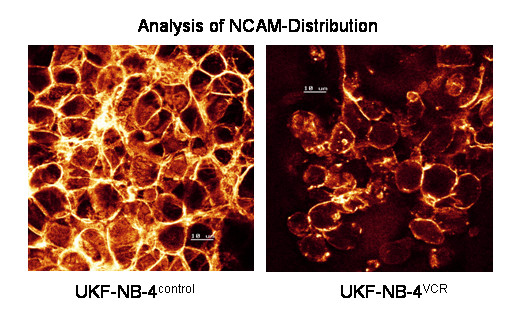
Figure 4.

Confocal analysis of NCAM distribution. UKF-NB-4 control versus UKF-NB-4VCR tumor cells were grown in standard medium. FITC conjugated monoclonal antibody clone 16.2 was used to analyze NCAM. The figure shows distinct NCAM expression at the intercellular boundaries on UKF-NB-4 control cells which is reduced in UKF-NB-4VCR. Scale = 10 μM. × 100/1.3 oil immersion objective.
