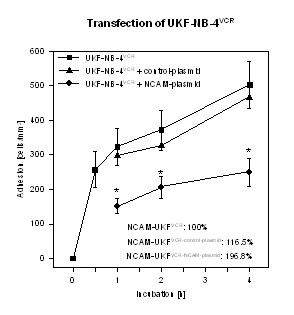
Figure 7.

Adhesion kinetics of UKF-NB-4VCR and of UKF-NB-4VCR transfected with 2 μg of full-length cDNA encoding the human NCAM-140 kDa isoforms are shown. Control cells were transfected with the expression vector alone. Data on NCAM surface expression, evaluated by flow cytometry, are given in the lower right hand corner. 100% value = 51.4 ± 18.7 MFU. X-axis indicates the period of co-culture (mean ± SD, n=3). *indicates significant difference to UKF-NB-4VCR.
