Fig. 3.
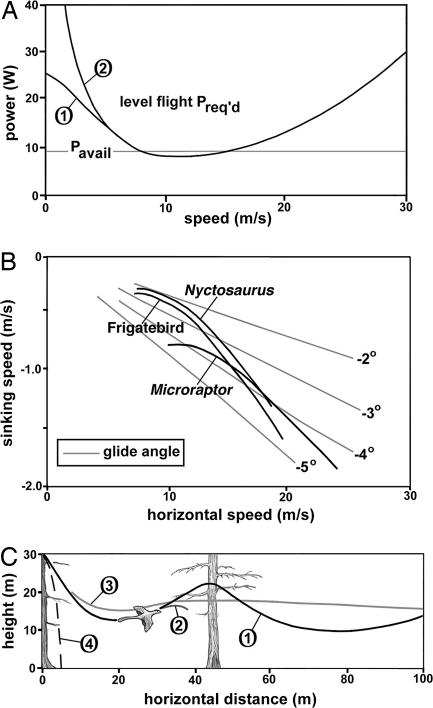
Flight performance of Microraptor. (A) Power curves (steady level flight) for Microraptor. The horizontal line represents the estimated maximum continuous power available. Two curves are shown for the level flight power required. Curve 1 is from streamtube theory (20), and curve 2 is based on the simpler aircraft theory (22). They converge for speeds of greater than ≈6 m/s. (B) Glide polars for Microraptor, compared with a seabird (frigatebird, M = 1.5 kg) and a pterosaur (Nyctosaurus, M = 1.85 kg) (ref. 22; see Table 1 for aerodynamic data). (C) Glide paths of Microraptor from a perch. Curve 1 shows phugoid gliding. Curve 2 shows a final rapid pitchup with high drag. Curve 3 shows gliding path with pitch damper on. Curve 4 shows a parachuting trajectory.

