
Figure 2.
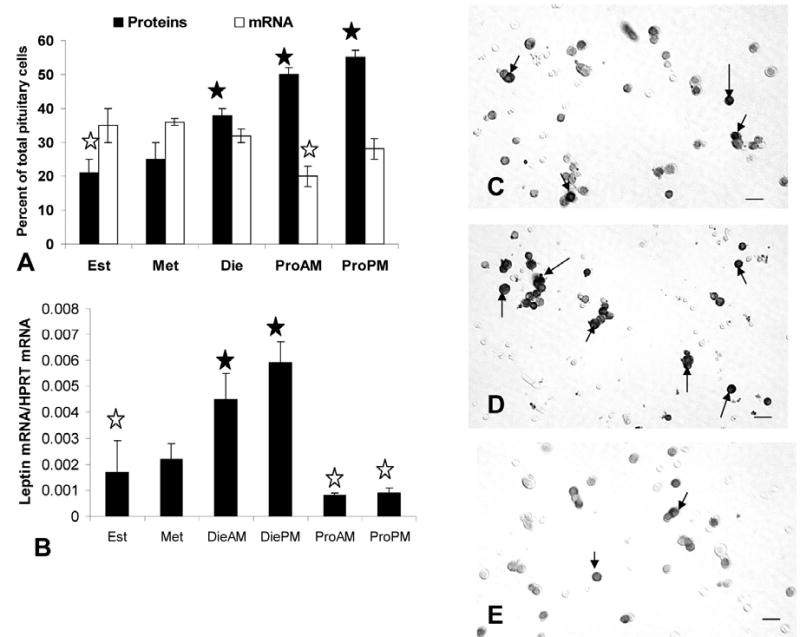
Expression of pituitary leptin proteins and mRNA in different stages of the cycle. Figure 2a is a graph showing the changes in percentage of AP cells with leptin proteins or mRNA with the stage of the cycle. Closed star=highest values in diestrus (die), or proestrus AM (ProAM) or PM (ProPM). Open stars=lowest values in estrus (est) or metestrus (met). Figure 2b shows a graph of the results from the QRT-PCR assays for leptin mRNA in extracts from pituitaries from cycling female rats. The rise in leptin mRNA from metestrus (met) to diestrus (die) is significant (p=0.014) as is the decline in expression from diestrus PM (diePM) to proestrus AM (p=0.002). Values remain low through estrus. Values for metestrous rat pituitaries are slightly higher than those for proestrous animals (p<0.022, proestrus AM and p<0.044, proestrus PM). Closed Star=highest levels; Open star=lowest levels. Figures 2c–e are light micrographs showing the increase in density of labeling from proestrous AM (Figure 2c) to proestrous PM (Figure 2d) and the loss of cellular leptin proteins on the AM of estrus (Figure 2e). Arrows=leptin bearing cell. Bar = 15 μm.