
Figure 4.
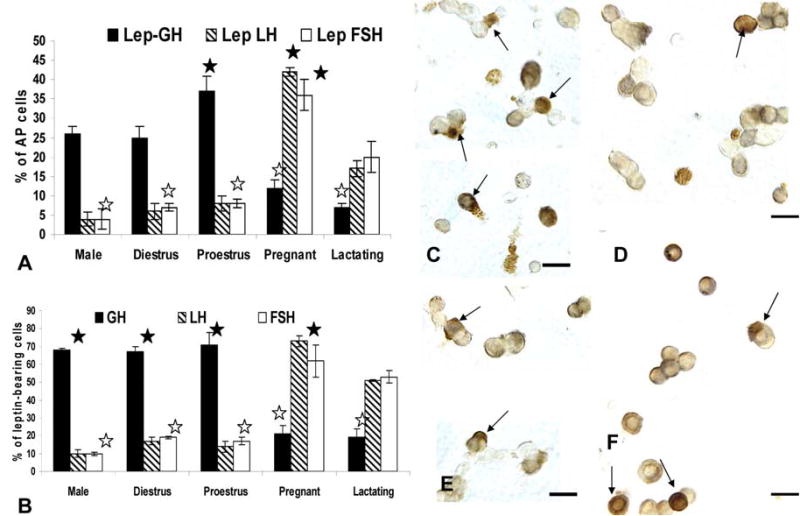
The top graph (Figure 4a) shows the counts of cells following dual immunolabeling for leptin proteins and LHβ, FSHβ or GH proteins and differences based on gender and reproductive state. The Y axis expresses the counts as percentages of total pituitary cells counted (% AP cells). See text for statistical details. Figure 4b shows the same counts expressed as percentages of leptin-bearing cells in these same experimental groups. See text for statistical differences. Filled stars=highest values and open stars=lowest values. Figure 4c and d illustrate fields from proestrous (Figure 4c) and pregnant (Figure 4c) dual labeled for leptin (black) and GH (orange). Numerous dual labeled cells (arrows) are evident only in the field from proestrous rats. In the pregnant rat, most of the gray, leptin-bearing cells do not contain GH. In contrast, Figures 4e and f are fields labeled for leptin (black) and LHβ (orange) from proestrous (Figure 4e) or pregnant (Figure 4f) animals. Only the field from the pregnant rat shows numerous dual labeled cells (arrows). In the proestrous rat, most of the gray, leptin bearing cells do not contain LHβ.