
Figure 5.
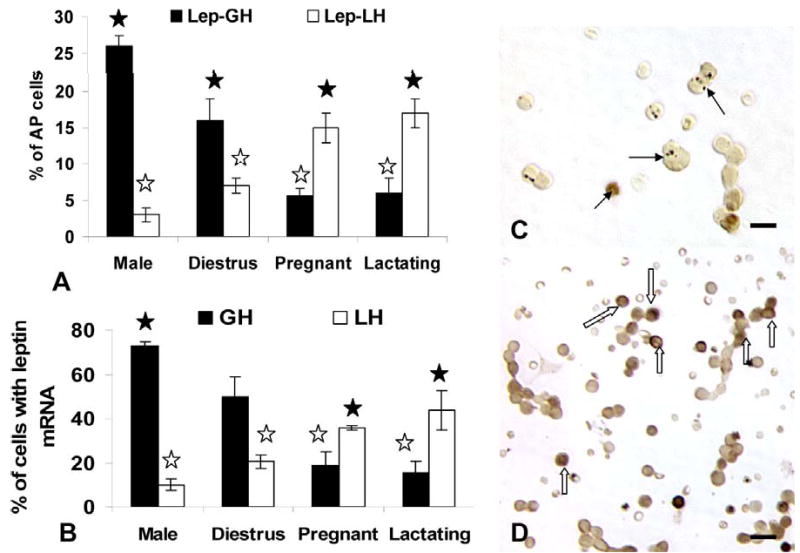
The top graph (Figure 5a) shows the counts of cells following dual labeling for leptin mRNA (with in situ hybridization) and LHβ or GH proteins and differences based on gender or reproductive state. The Y axis shows the counts as percentages of anterior pituitary cells. The bottom graph (Figure 5b) expresses these same counts as percentages of leptin-bearing cells. See text for statistical details. The colored photographs in Figure 5c depicts a dual labeled field from a pregnant rat showing a number of cells leptin mRNA (black patches, arrows) and GH (orange), but no dual-labeled cells. Bar=15 μm Figure 5d depicts a field from a pregnant rat dual labeled for leptin mRNA (black) and LHβ proteins (orange). Many dual labeled cells are shown in this field (hollow arrows) Bar=20 μm.