
Figure 7.
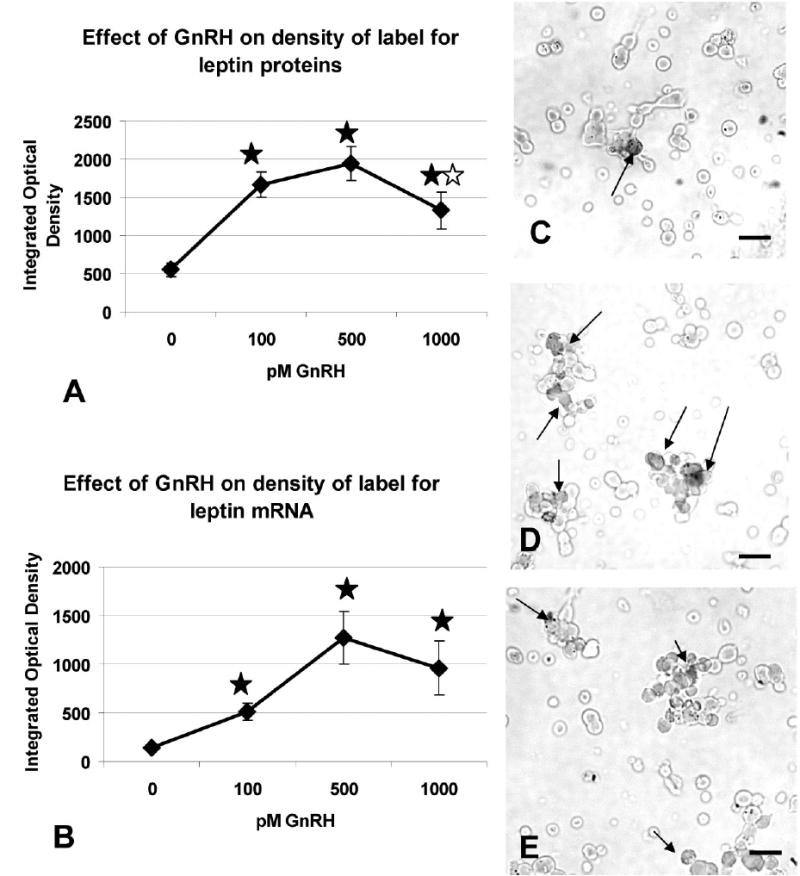
Cellular leptin proteins (Figure 7a) and mRNA (Figure 7b) were analyzed by automated image analysis and the Integrated Optical Density was calculated for each field. The Y axis is the average integrated optical density calculated over 20–25 randomly selected fields ± sem. Closed star= significantly different from vehicle control (see text for statistical details). Open star=significantly different from IOD with 500 pM. Photographs depict the labeling for leptin mRNA in the vehicle (Figure 7c), 100 pM GnRH treated (Figure 7d) or 1 nM GnRH treated (Figure 7e) cultures. Arrows show labeling for leptin mRNA. Bar=15 μm.