
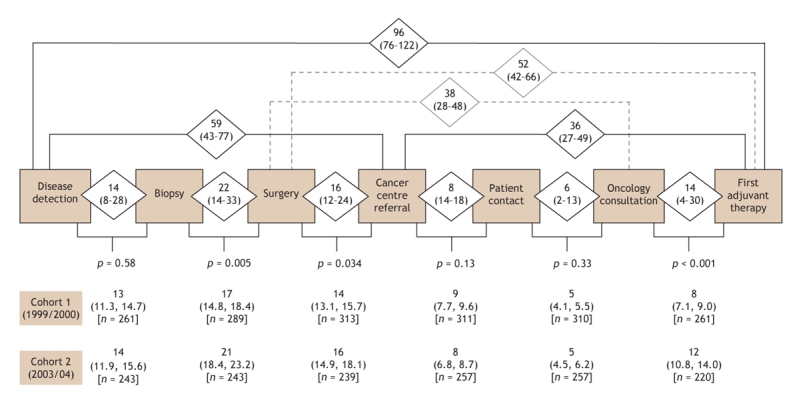
Fig. 2: Elapsed times between care intervals for women with newly diagnosed invasive breast cancer referred to a Nova Scotia cancer centre between Sept. 1, 1999, and Sept. 1, 2000 (cohort 1) and between Sept. 1, 2003, and Sept. 1, 2004 (cohort 2). Median number of days (unadjusted for cofactors) with first and third quartiles (cohorts combined) are shown in diamonds. Geometric mean number of days (adjusted for cofactors) with 95% confidence intervals (cohort comparison) are shown below each care interval. The significance in the differences in elapsed days observed between cohort periods is indicated by p values.