
Figure 6.
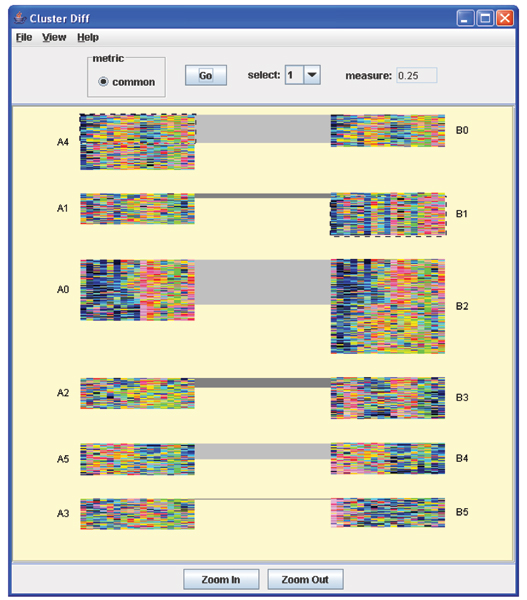
Screenshot of cluster similarity analysis. The similarity analysis results of clusters generated by SOTA and SOM. The matched parts are linked by lines in grey colour.
Official websites use .gov
A
.gov website belongs to an official
government organization in the United States.
Secure .gov websites use HTTPS
A lock (
) or https:// means you've safely
connected to the .gov website. Share sensitive
information only on official, secure websites.
Screenshot of cluster similarity analysis. The similarity analysis results of clusters generated by SOTA and SOM. The matched parts are linked by lines in grey colour.