
Figure 4.
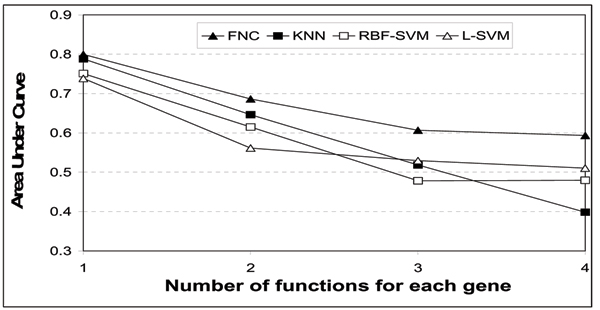
Comparison of areas under curves for genes with multiple functions. Note that we use the full curves (up to N=48) for calculating the area, while Figure 3 shows the results for only up to N=20 due to space constraints.
Official websites use .gov
A
.gov website belongs to an official
government organization in the United States.
Secure .gov websites use HTTPS
A lock (
) or https:// means you've safely
connected to the .gov website. Share sensitive
information only on official, secure websites.
Comparison of areas under curves for genes with multiple functions. Note that we use the full curves (up to N=48) for calculating the area, while Figure 3 shows the results for only up to N=20 due to space constraints.