
Figure 2.
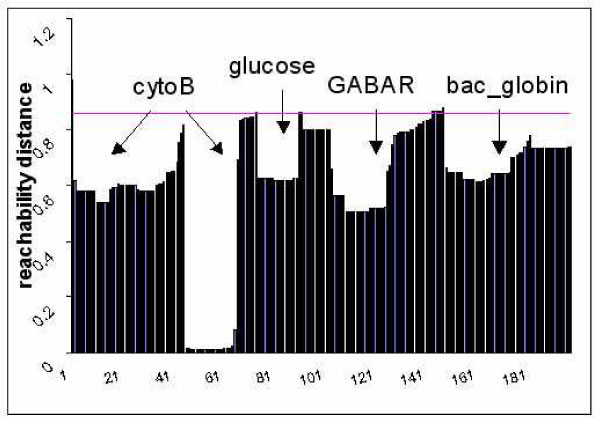
Cluster structure of data set 1 (Pfam). Valleys represent clusters and the purple line stands for the cutoff value for extracting clusters. This figure shows 5 valleys corresponding to 4 protein families.
Official websites use .gov
A
.gov website belongs to an official
government organization in the United States.
Secure .gov websites use HTTPS
A lock (
) or https:// means you've safely
connected to the .gov website. Share sensitive
information only on official, secure websites.
Cluster structure of data set 1 (Pfam). Valleys represent clusters and the purple line stands for the cutoff value for extracting clusters. This figure shows 5 valleys corresponding to 4 protein families.