
Figure 6.
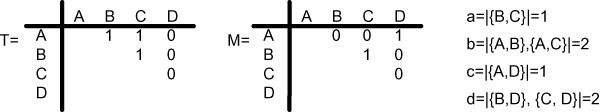
Comparison of Two Cluster Sets T and M. By counting those sequence pairs clustered in the same way and those clustered differently in T and M, the Jaccard Coefficient is: S(T, M) =  = 0.25. the Precision is: P(T, M) =
  = 0.5, the Recall is: S(T, M) =
  = 0.33.