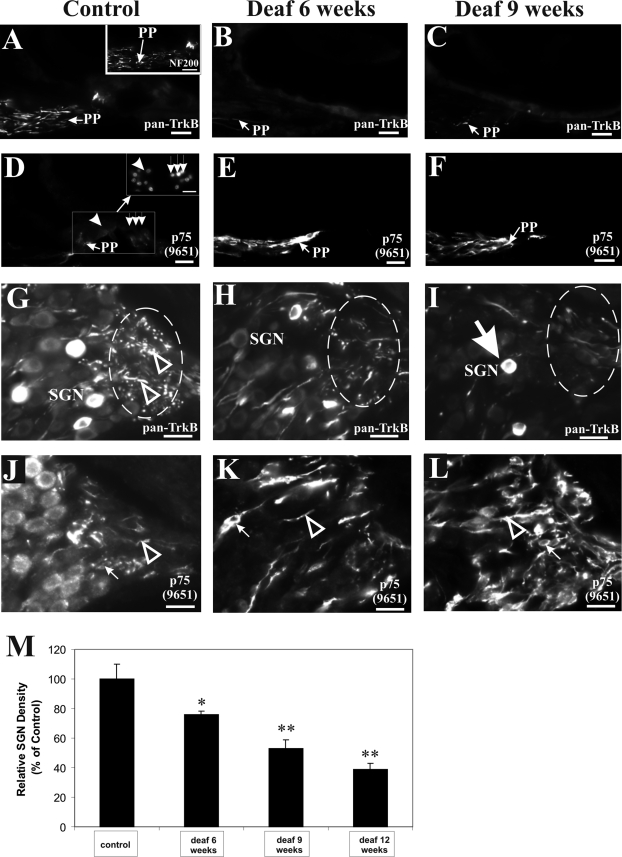
Figure 1-6921.
SGN degeneration involves a reduction in TrkB expression, coincident with an aberrant elevation of p75NTR expression in the peripheral processes. Normal hearing animals express TrkB in the peripheral processes projecting from the SGNs to the organ of Corti, as shown in the osseous spiral lamina (A, left panel, PP). The identity of peripheral processes could be established by NF200 immunolabeling (A, inset). After aminoglycoside-induced deafening, TrkB immunoreactivity in the osseous spiral lamina was reduced as shown here after 6 weeks (B, middle panel, PP) and 9 weeks (C, right panel, PP) of deafness. D: In normal hearing cochleae, p75NTR is weakly expressed in the peripheral processes (PP) projecting to the inner (arrowhead) and outer hair cells (row of three downward arrows), identified with DAPI staining in the inset. After aminoglycoside-induced deafening, p75NTR immunoreactivity in the osseous spiral lamina was strongly up-regulated as illustrated here after 6 weeks (E, RF) and 9 weeks (F, RF) of deafness in adjacent sections to B and C, respectively. Most of the peripheral processes of SGNs are clustered in a region of the Rosenthal’s canal before projecting to the osseous spiral lamina (G, circle). In normal hearing animals, dense TrkB expression could be observed in this region as punctated or filamentous-like fluorescence (G, arrowhead). After 6 weeks of deafness, TrkB staining in this region was comparatively reduced (H, circle), and a further down-regulation of TrkB in this region was observed after 9 weeks of deafness (I, circle). Some surviving SGNs showed strong TrkB immunoreactivity (I, arrow), comparable with those seen in normal hearing animals. Using a polyclonal p75NTR antibody (Ab9651), a strong up-regulation of p75NTR could be observed in both fibers and putative Schwann cells after 6 weeks (K, arrowhead pointing to fiber and arrow to Schwann cell) and 9 weeks (L, arrowhead pointing to fiber and arrow to Schwann cell) of deafness, relative to similar structures in normal hearing cochleae (J). Cochlear sections shown here were taken from the middle turn. Scale bar = 20 μm. Original magnification, ×40. M: Quantification of SGN density in the middle turn at varying time points after aminoglycoside administration. Graphs indicate means ± SEM. A 24% reduction in SGN density relative to normal hearing cochleae (n = 4) was observed after 6 weeks of deafness (n = 3), progressing to 47 and 61% reduction after 9 weeks (n = 3) and 12 weeks (n = 2) of deafness, respectively. Statistical significance determined by Student-Newman-Keuls one-way analysis of variance between each deafness cohort and the control group is indicated by asterisks. There was a significant reduction in SGN density after 6 (*P < 0.05), 9 (**P < 0.01), and 12 (**P < 0.01) weeks of deafness.

