Figure 4.
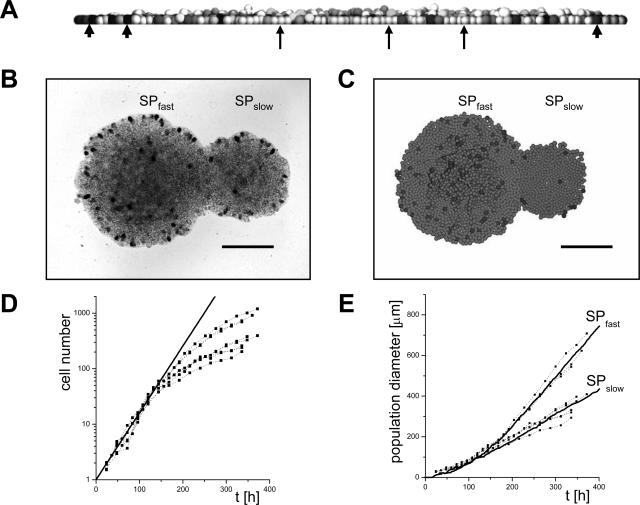
Experimental and computer-simulated colony growth. A: Vertical section through a growing computer model population. The gray value of the cells is a marker of the cell volume. Black cells (arrowheads) are in the act of starting division; white cells (arrows) underwent contact inhibition of growth; ie, they are quiescent because of compression by neighboring cells. B: Top view on two cultured Widr empty control populations after 14 days stained for proliferation by BrdU. They grow from cells of different subpopulations (SPfast, SPslow). C: Computer simulation results related to B. D: Cell number of CD97 (EGF 1,2,5)-transfected Widr cell colonies versus time t. The thick line indicates exponential growth according to a cell doubling time of 25 hours. E: Diameter of the colonies shown in D. Lines are computer simulation results applying the parameter sets of Widr empty control cells for SPfast and SPslow and considering the doubling time of the transfected cells. Scale bars = 200 μm.

