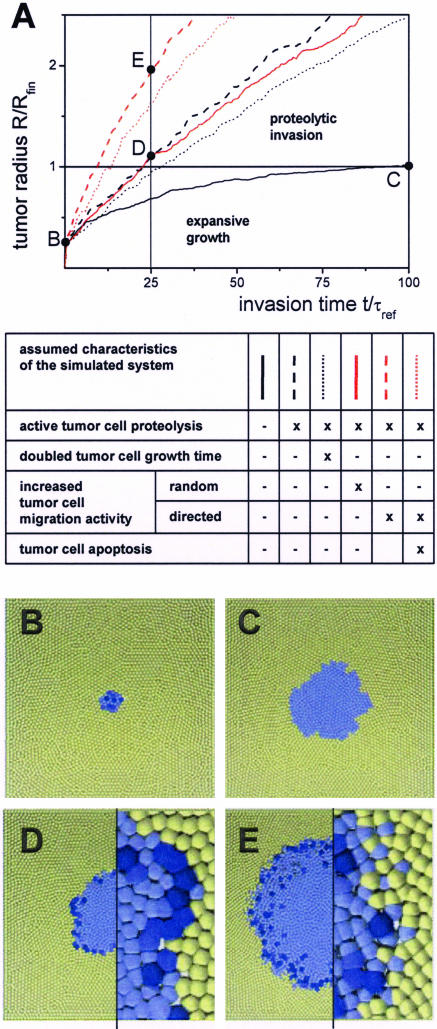
Figure 5.
Computer model results on tumor invasion. A: Effects of tumor cell properties on invasion dynamics. The tumor radius R is scaled with the finite tumor radius Rfin obtained without stroma degradation (black solid line); the time t with the reference cell growth time τref of 21 hours. B–E: Snapshots of computer-simulated tumors at the selected times points indicated in A. Tumor cells are blue; stroma cells are yellow. Color saturation indicates immanent cell division. Without proteolytic activity of the tumor cells (A, black solid line) tumor expansion starting from a small initial tumor (B) stops because of contact inhibition of growth after ∼100 τref (C). Proteolytic activity of the tumor cells (A, black dashed line) enables persistent tumor invasion. Thus, the tumor radius reaches the value of Rfin already after ∼25 τref (D). The invasion is only moderately slowed, doubling the tumor cell growth time τ (A, black dotted line). In contrast to enhanced random migration (A, red solid line), enhanced directed migration in the presence of active proteolysis (A, red dashed line) strongly promotes invasion by roughening the proteolytic active interface (compare magnifications in D and E). Regardless of that large interface, stroma contact-induced tumor cell apoptosis has only weak effects on invasion (A, red dotted line). Box height: 800 μm (B–E); magnifications; 160 μm (D, E).

