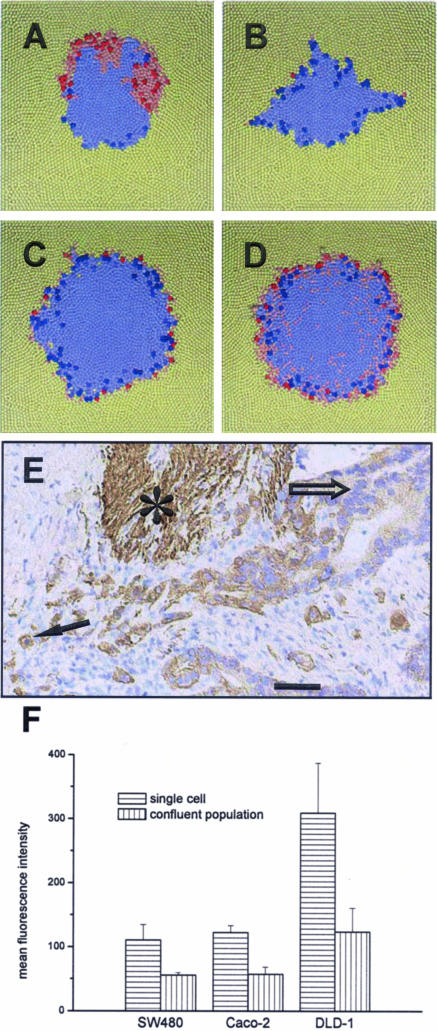
Figure 6.
On the origin of increased CD97 expression in scattered tumor cells at the invasion front of colorectal carcinoma. Top view on computer model systems after an invasion time of 25 reference cell growth times of 21 hours. Altered cells (red) are characterized by a four times increased migration coefficient and a directed migration at the tumor invasion front. Saturated color indicates imminent cell division. A: Invasion after a mutation (stable alteration) of a single cell. The clone of that cell has spread partially throughout the tumor front. B–D: Invasion considering regulated alteration. Tumor cells become altered if the number of tumor cell neighbors falls below two (B), four (C), and six (D), respectively. Accordingly, altered cells occur at the tumor front. This corresponds to the expression of CD97 found in colorectal carcinoma (E). Stronger expression of CD97 is found in scattered tumor cells or tumor cell groups (arrow) surrounded by stroma compared with tumor cells located in tumor glands or solid tumor trabecula (open arrow). Smooth muscle cells (asterisk) also express CD97.43 F: CD97 expression in colorectal carcinoma cell lines, here shown for SW480, Caco-2, and DLD-1 cells, forming confluent layers is significantly decreased compared with that in single cell cultures of the same cell type as shown by flow cytometry (mean ± SEM, n = 3). The result does not depend on absolute CD97 expression levels. Box height, 800 μm (A–D). Scale bar = 50 μm.

