
FIGURE 1.
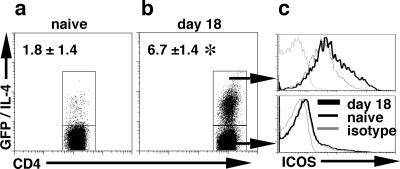
ICOS expression on CD4+ Th2 effector cells. BALB/c 4get mice were infected with 200 T. muris eggs, and after 18 days of infection, mLN cells were recovered from naïve (n = 8) (a) and infected mice (n = 16) (b) and incubated with Abs to CD4 and ICOS. Representative ICOS expression on GFP/IL-4+ (c, upper panel) and GFP/IL-4- (c, lower panel) from naive and infected mice is presented. The numbers in each plot are the percentage (±SD) of live CD4+ T cells that are GFP/IL-4+ from 8 naive and 16 infected mice over four individual experiments. Significance is p < 0.001 and is illustrated by *.