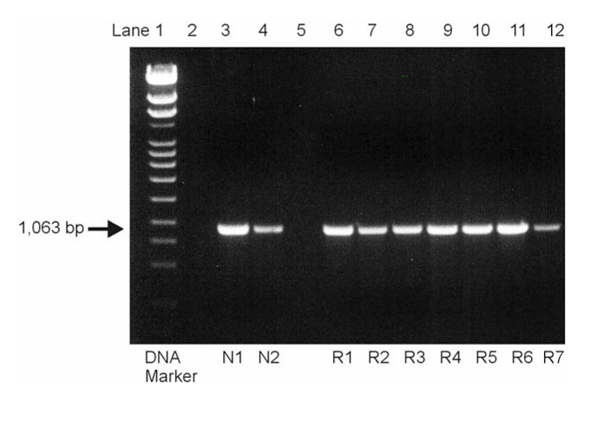
Figure 1.

Analysis of the amplified polymerase chain reaction products by electrophoresis on a 1% agarose gel. The expected PTEN band was visible in all normal (N1, N2 in lanes 3 and 4) and rheumatoid arthritis (R1-R7 in lanes 6–12) specimens, and no additional transcripts could be detected, even at lower specificity.
