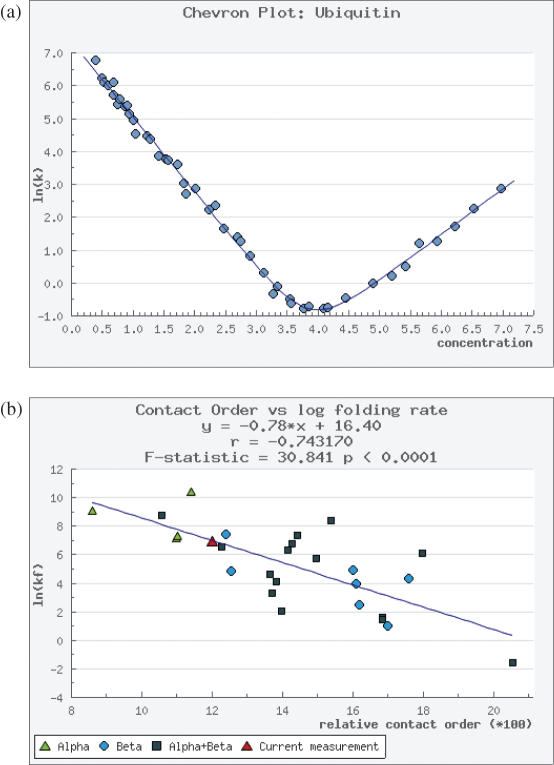
Figure 2.
(A) Raw data, such as ln(kobs) versus denaturant concentration can be deposited and automatically plotted (the chevron plot is shown) and (B) the contact order plot shown here is automatically calculated from the database contents. Each data point represents a protein, and can be selected directly from the plot.

