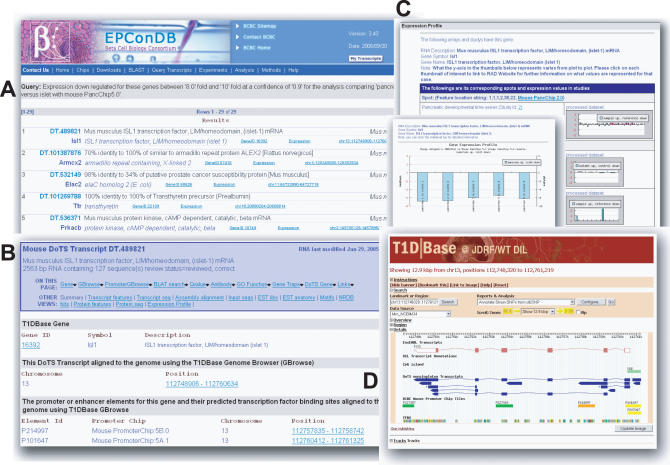
Figure 2.
(A) The results page from a query for transcripts with Down regulated Expression in total pancreas as compared with islet tissue having a fold change in expression between 8-fold and 10-fold and a PaGE confidence of 0.9. Twenty-nine transcripts, including a transcript for the gene, Isl1, ISL1 transcription factor, LIM/homeodomain (islet 1), were returned from the query. (B) The transcript page for DT.489821, a DoTS transcript associated with the gene, Isl1. On the transcript page, annotations are displayed including a link to the T1DBase/EPConDB Gene Page and links to the T1DBase Genome Browser. Links to other views for the transcript such as Protein features, EST anatomy and Expression Profile are also available. (C) The Expression Profile link displays gene expression profiles derived from expression studies. Clicking on an individual profile displays the graph and additional information about the study. (D) The T1DBase GBrowse view shows the transcript aligned to the genome. Other views include the BCBC PromoterChip elements and predicted transcription factor binding sites.

