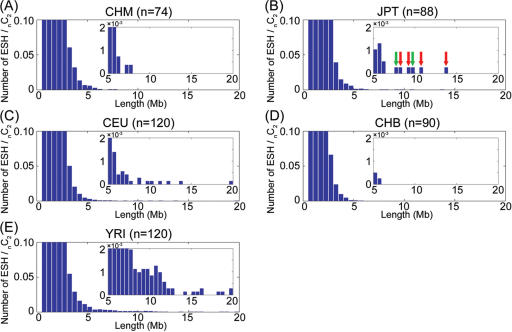
Figure 3.
The length distribution of the ESHs. The number of ESHs, normalized by the number of combinations of chromosomes, in the populations of CHM (A), JPT (B), CEU (C), CHB (D) and YRI (E) are shown. ESHs longer than 500 kb were counted. The SNP intervals longer than 100 kb were treated as breaks in the ESHs. It is noteworthy that unusually long haplotypes were observed in the JPT samples, while no such long ESHs were detected in the CHM samples. The long ESHs originating from the same individuals in JPT are indicated by the green and red arrows.

