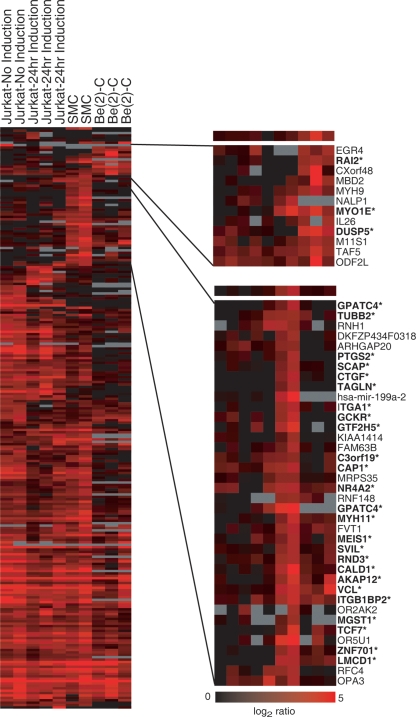
Figure 1.
SRF binding in three cell types. For each cell type and each putative target, the intensity of red indicates size of the Z-score obtained from the arrays. The right panel displays a subset of genes bound specifically by SRF in neurons (top) and smooth muscle cells (bottom). Gene names followed by an asterisk have been validated by quantitative PCR or were previously known.

