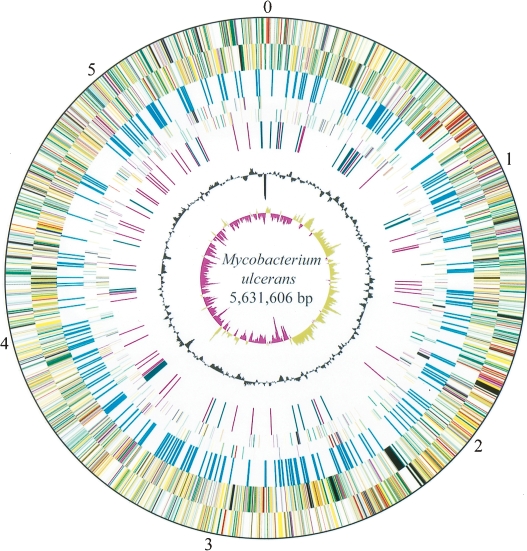
Figure 1.
Circular representation of the Mycobacterium ulcerans chromosome. The scale is shown in megabases in the outer black circle. Moving inward, the next two circles show forward and reverse strand CDS, respectively, with colors representing the functional classification (red, replication; light blue, regulation; light green, hypothetical protein; dark green, cell wall and cell processes; orange, conserved hypothetical protein; cyan, IS elements; yellow, intermediate metabolism; gray, lipid metabolism; purple, PE/PPE). The location of each copy of IS2404 and IS2606 is then shown (cyan). The following two circles show forward and reverse strand pseudogenes (colors represent the functional classification), followed by the G+C content and finally the GC skew (G−C)/(G+C) using a 20-kb window.

